Wireshark is the best known and most widely used packet analyzer worldwide. Thanks to this program, we will be able to capture and analyze in detail all the network traffic that enters and leaves our PC, in addition, we must remember that it is cross-platform, this means that it is available for Windows, Linux, macOS, Solaris, FreeBSD, NetBSD and others. Today in this article we are going to teach you in a basic way, how to perform a traffic capture, and how to analyze network traffic to see if there is any type of anomaly.
Wireshark main features
This program, which is completely free, allows us to perform deep inspection of hundreds of protocols, since it supports protocols of physical layer, link, network protocols, transport layer and also application layer. It will allow us to capture in real time, and when we have finished capturing all the packets that enter and leave our wired or wireless network card, we can carry out an in-depth analysis offline, that is, on another computer (or in the same) and at any time.

Wireshark allows to see all the traffic captured via GUI with the program itself, however, we can also see all the information captured with the TShark program, a tool that works through the console and will allow us to read everything through the CLI command line , to see everything via SSH, for example. A fundamental characteristic of any packet analyzer is the filters, so that it only shows us what we want it to show us, and no more information that would generate extra work for us.
Wireshark is capable of reading and writing in different capture formats, such as tcpdump (libpcap), pcap ng, and many other extensions, to perfectly adapt to different programs for further analysis. Another important aspect is that the captured capture can be compressed with GZIP on the fly, and of course, decompress it on the fly also in case we are reading the capture. Of course, it is capable of reading data from different network technologies such as Ethernet, IEEE 802.11, PPP / HDLC, ATM, Bluetooth, USB, Token Ring, Frame Relay, FDDI and others. Today we have many protocols with encrypted data, with the appropriate private key, Wireshark is able to decrypt the traffic of different protocols such as IPsec, ISAKMP, Kerberos, SNMPv3, SSL / TLS, WEP, and WPA / WPA2.
Once we have seen the main features, we will download and install it.
Download and install
This program is completely free, we can directly access the official Wireshark website where you can find the links for download. The installation of this program is very simple, we simply have to follow the installation wizard step by step, and restart the computer when finished. Wireshark is a program that is constantly updated, so it is highly recommended to always have the latest version installed on our computer to enjoy the latest news.
If you have a Linux based operating system, it is very likely that in your package manager you have Wireshark, and you simply have to run a command like this:
sudo apt install wireshark
Once we have seen how to download and install Wireshark, we are going to use it to capture data.
Take a traffic capture with Wireshark in Windows 10
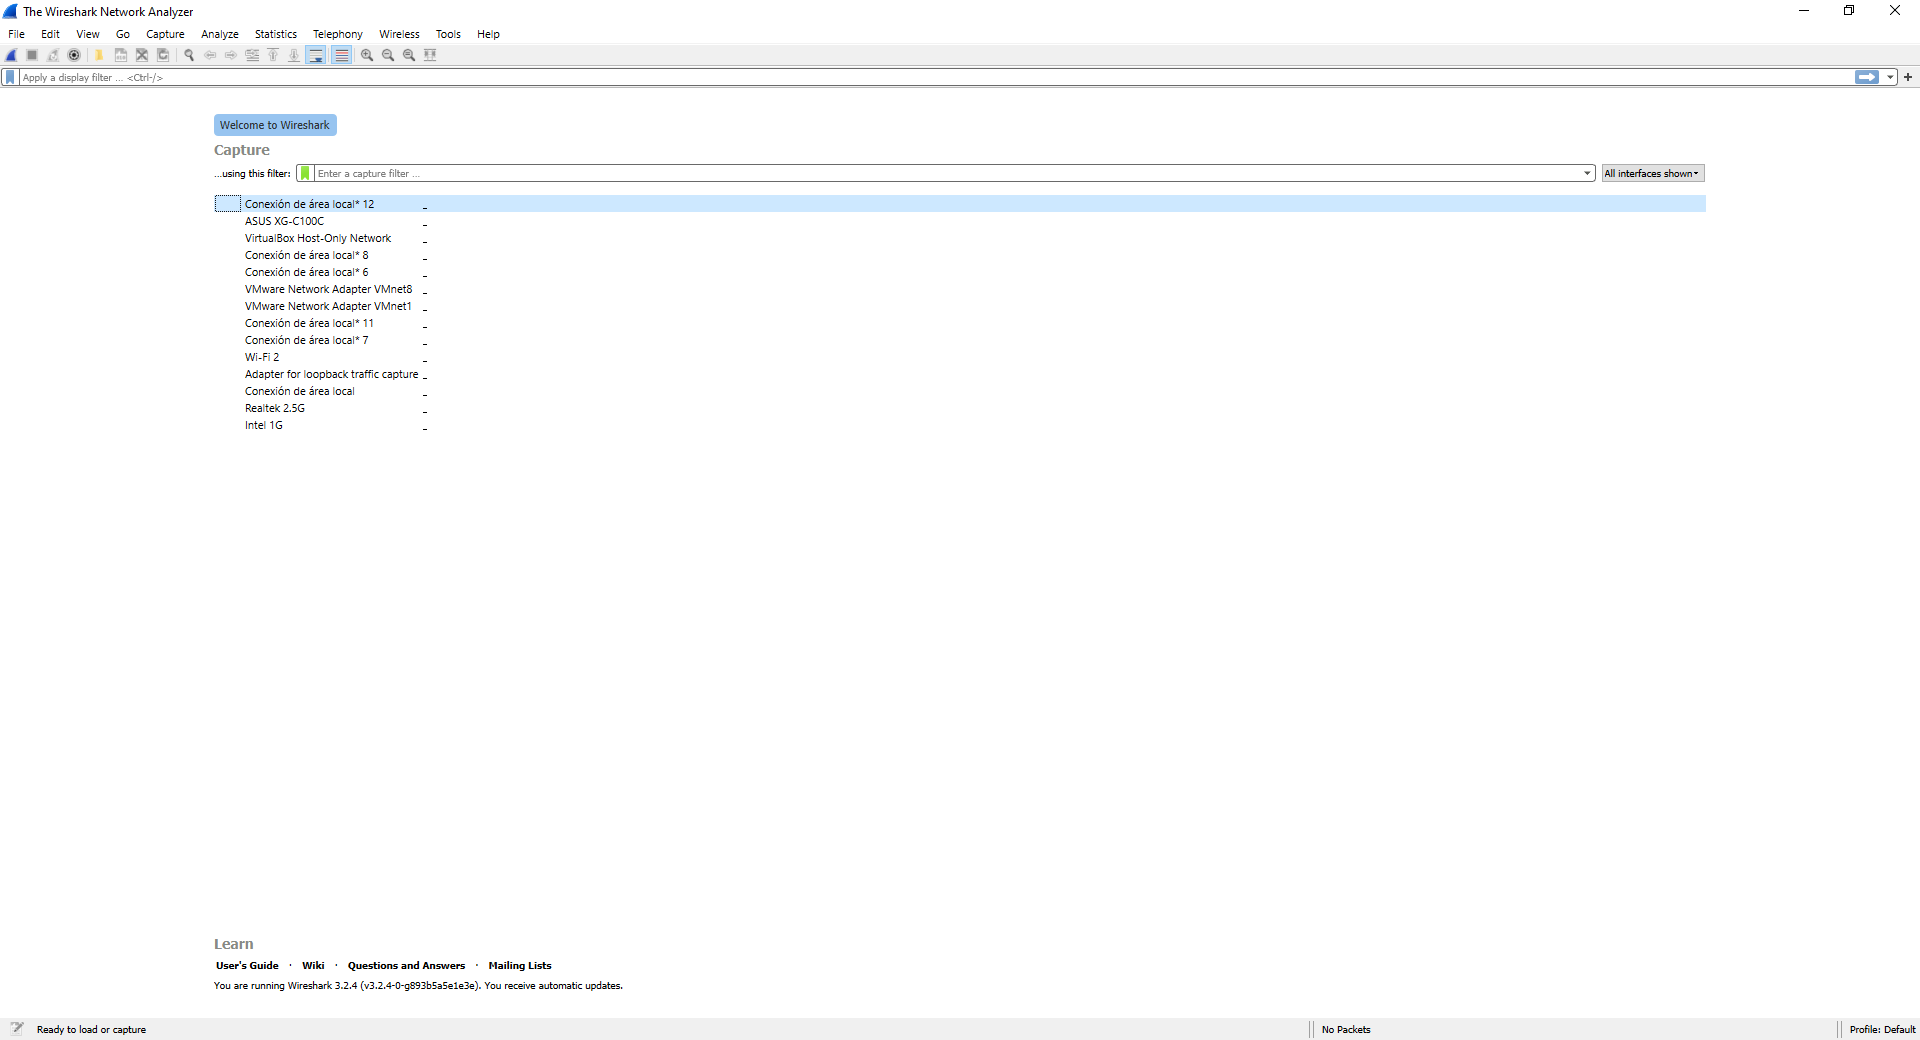
We have used the Windows 10 operating system to perform traffic capture, but on Linux or macOS systems it is exactly the same, since we have exactly the same graphical user interface. The first thing we will see when starting this program are all the network cards and network interfaces of our computer, in our case we have a total of three wired network cards ( ASUS XG-C100C, Realtek 2. 5G and Intel 1G), one card Wi-Fi network ( WiFi 2), in addition, we have different virtual network interfaces that correspond to the VMware and Virtual Box interfaces.
Wireshark allows us to capture the traffic of any network card, whether physical or virtual, we simply have to be clear about which network card is currently in use, and from which we want to capture network traffic. In our case it is the ASUS XG-C100C, so we simply double click on this card.
Double-clicking will automatically start capturing all network traffic, both inbound and outbound. Some recommendations BEFORE performing a traffic capture are the following:
- Close all programs that generate network traffic, which we do not want to capture
- Make sure that the firewall is disabled, as it could block certain traffic and it will not appear in Wireshark, or only part of the generated traffic will appear.
- If we want to capture some data traffic generated by an application, it is recommended to wait 1 second before starting it and to capture network traffic from the computer, then we run that application, and finally, we close the application and wait 1 second before stop capturing traffic.
With these recommendations, we are sure that the traffic capture you make will be a success.
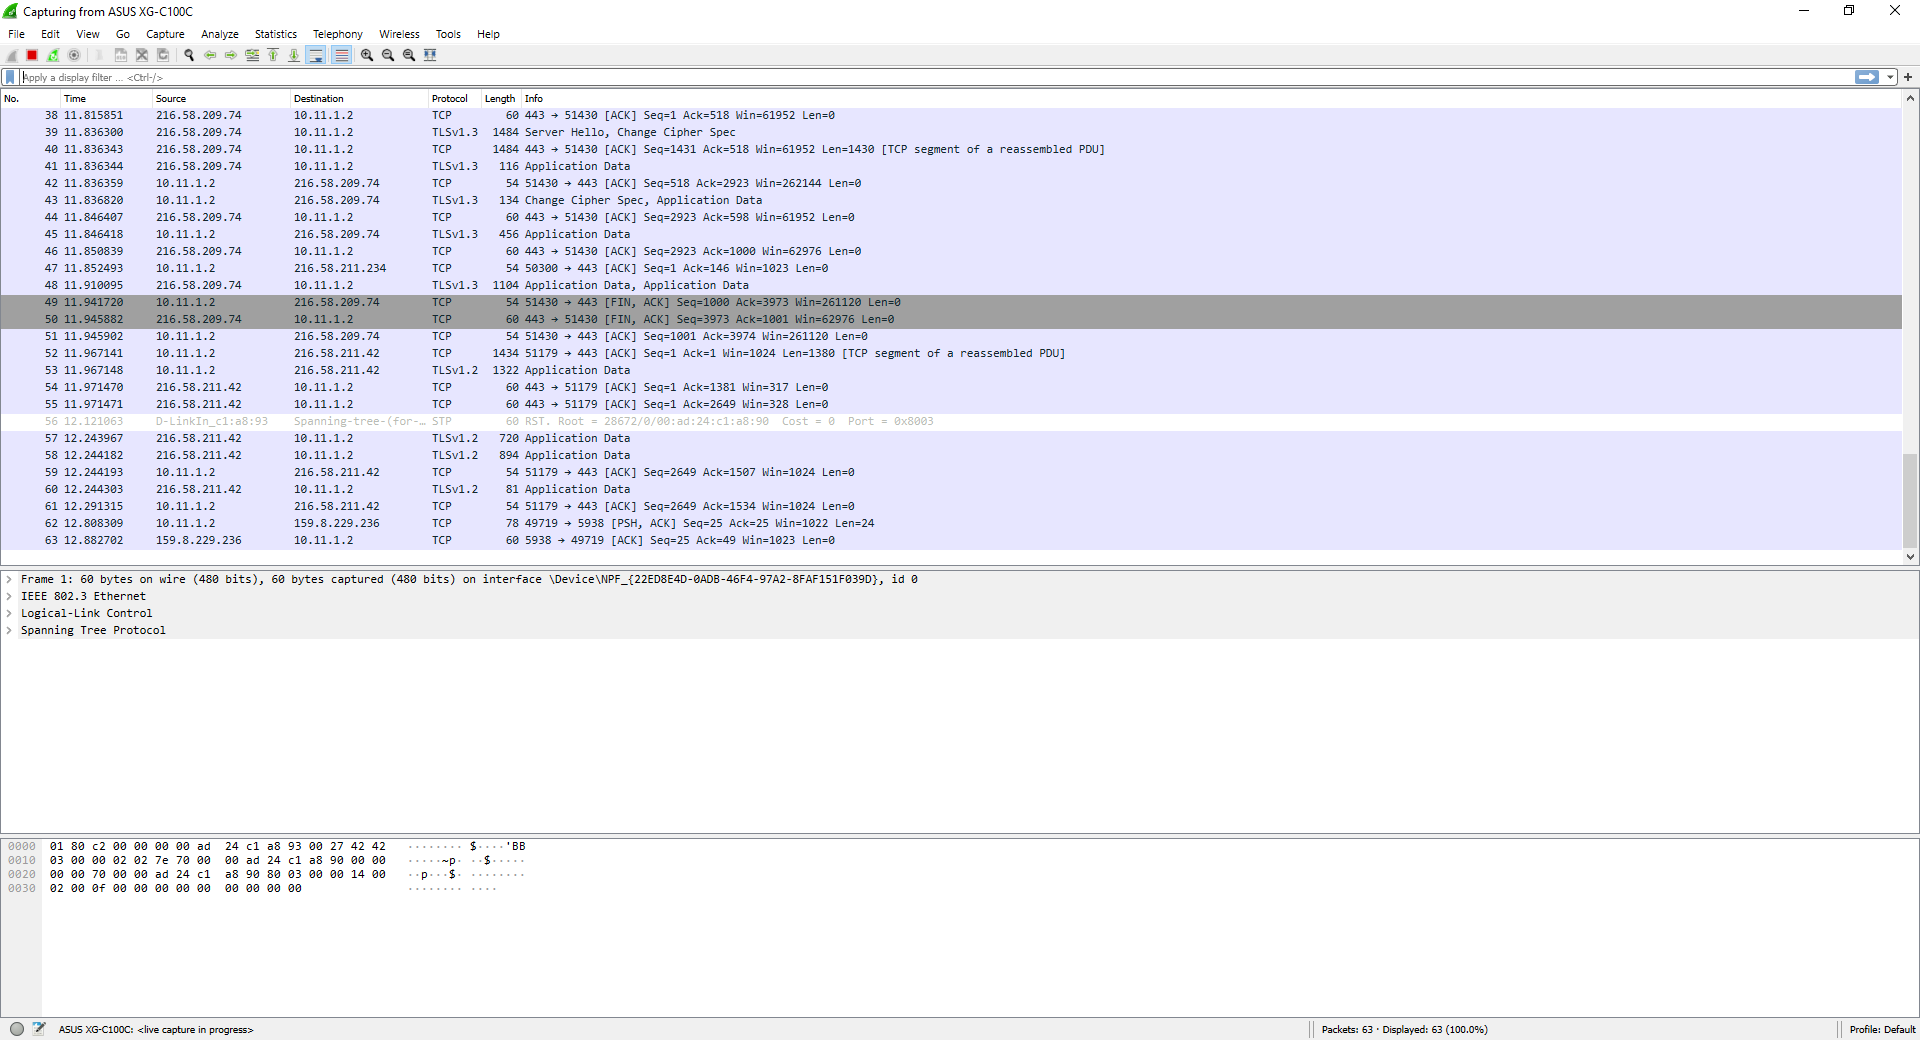
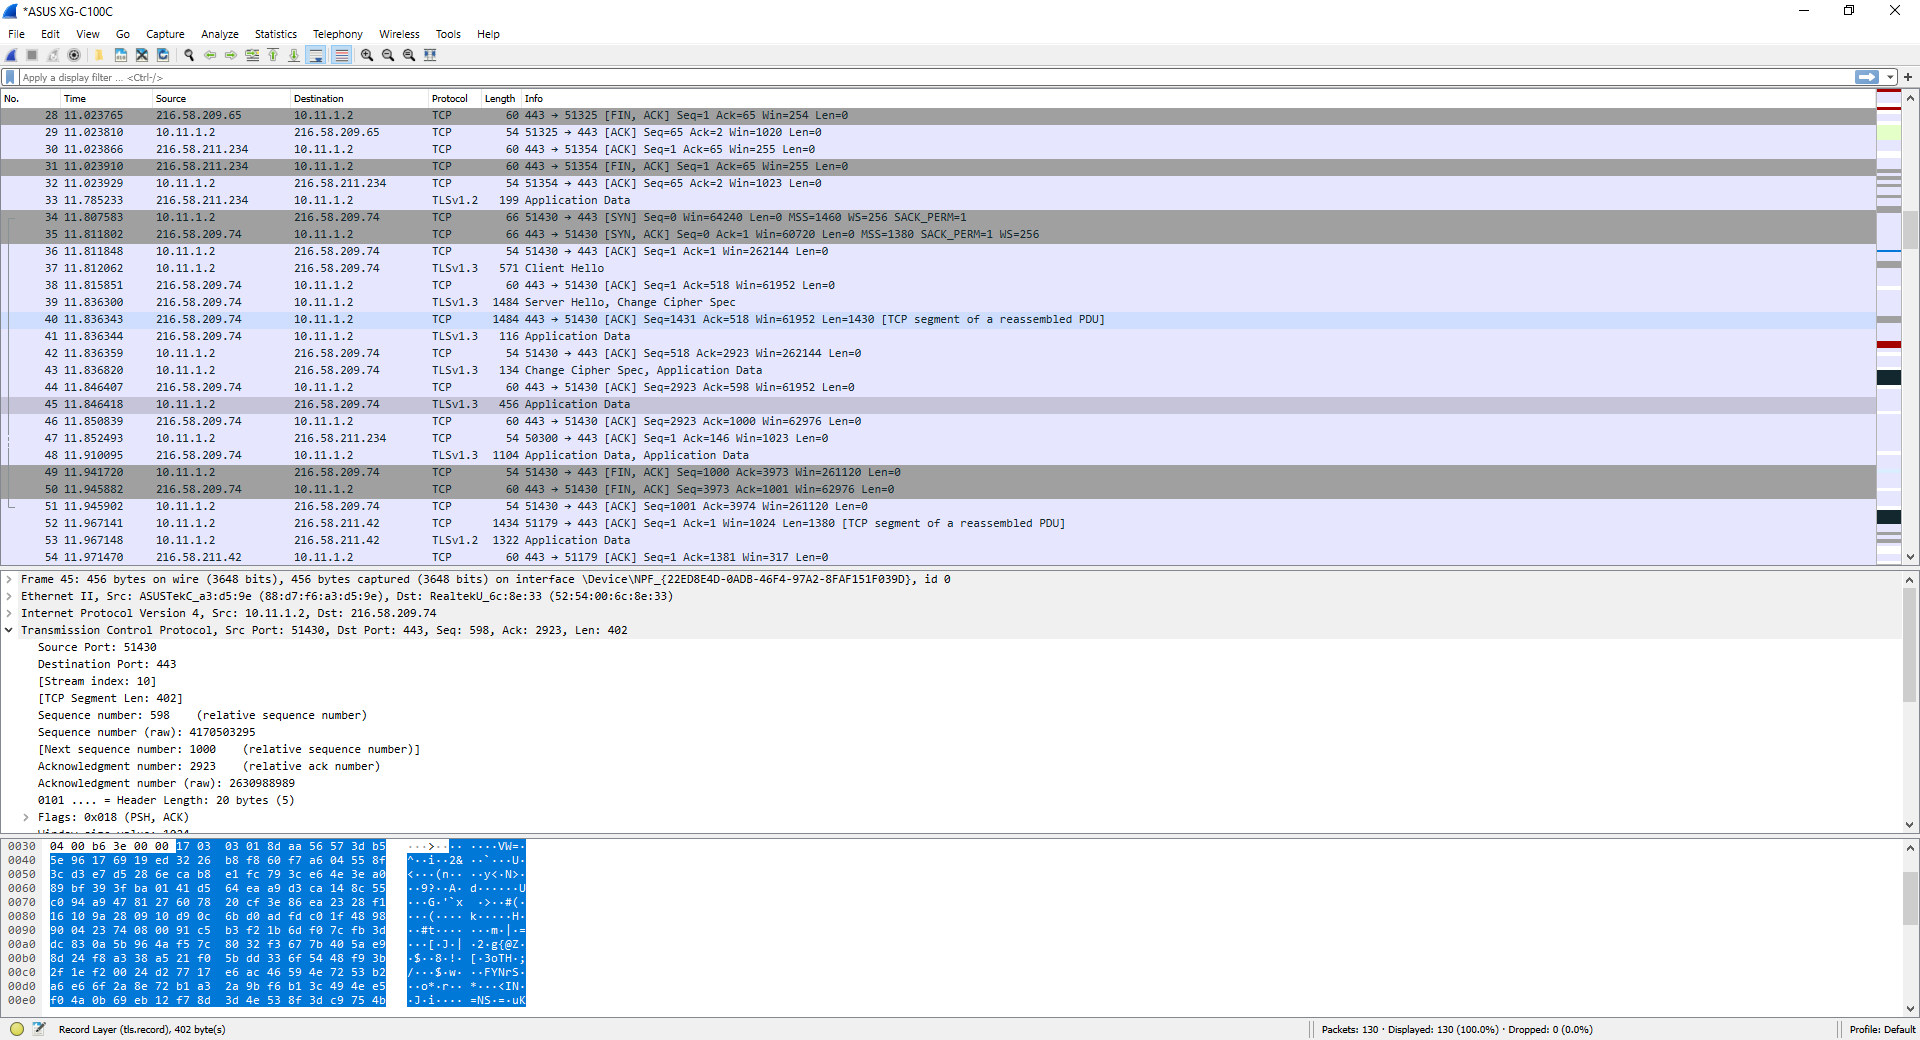
In this traffic capture, you can see traffic from different protocols, both traffic from the Spanning-Tree Protocol of the network, as well as TCP traffic and TLSv1.2 traffic from different applications that we have open.
With each data entry, we will be able to display and see in detail the entire data package, both at the application level, transport, at the network level, link and also at the physical level, that is, Wireshark will provide us with information by layers, to find the information we need to know more easily.
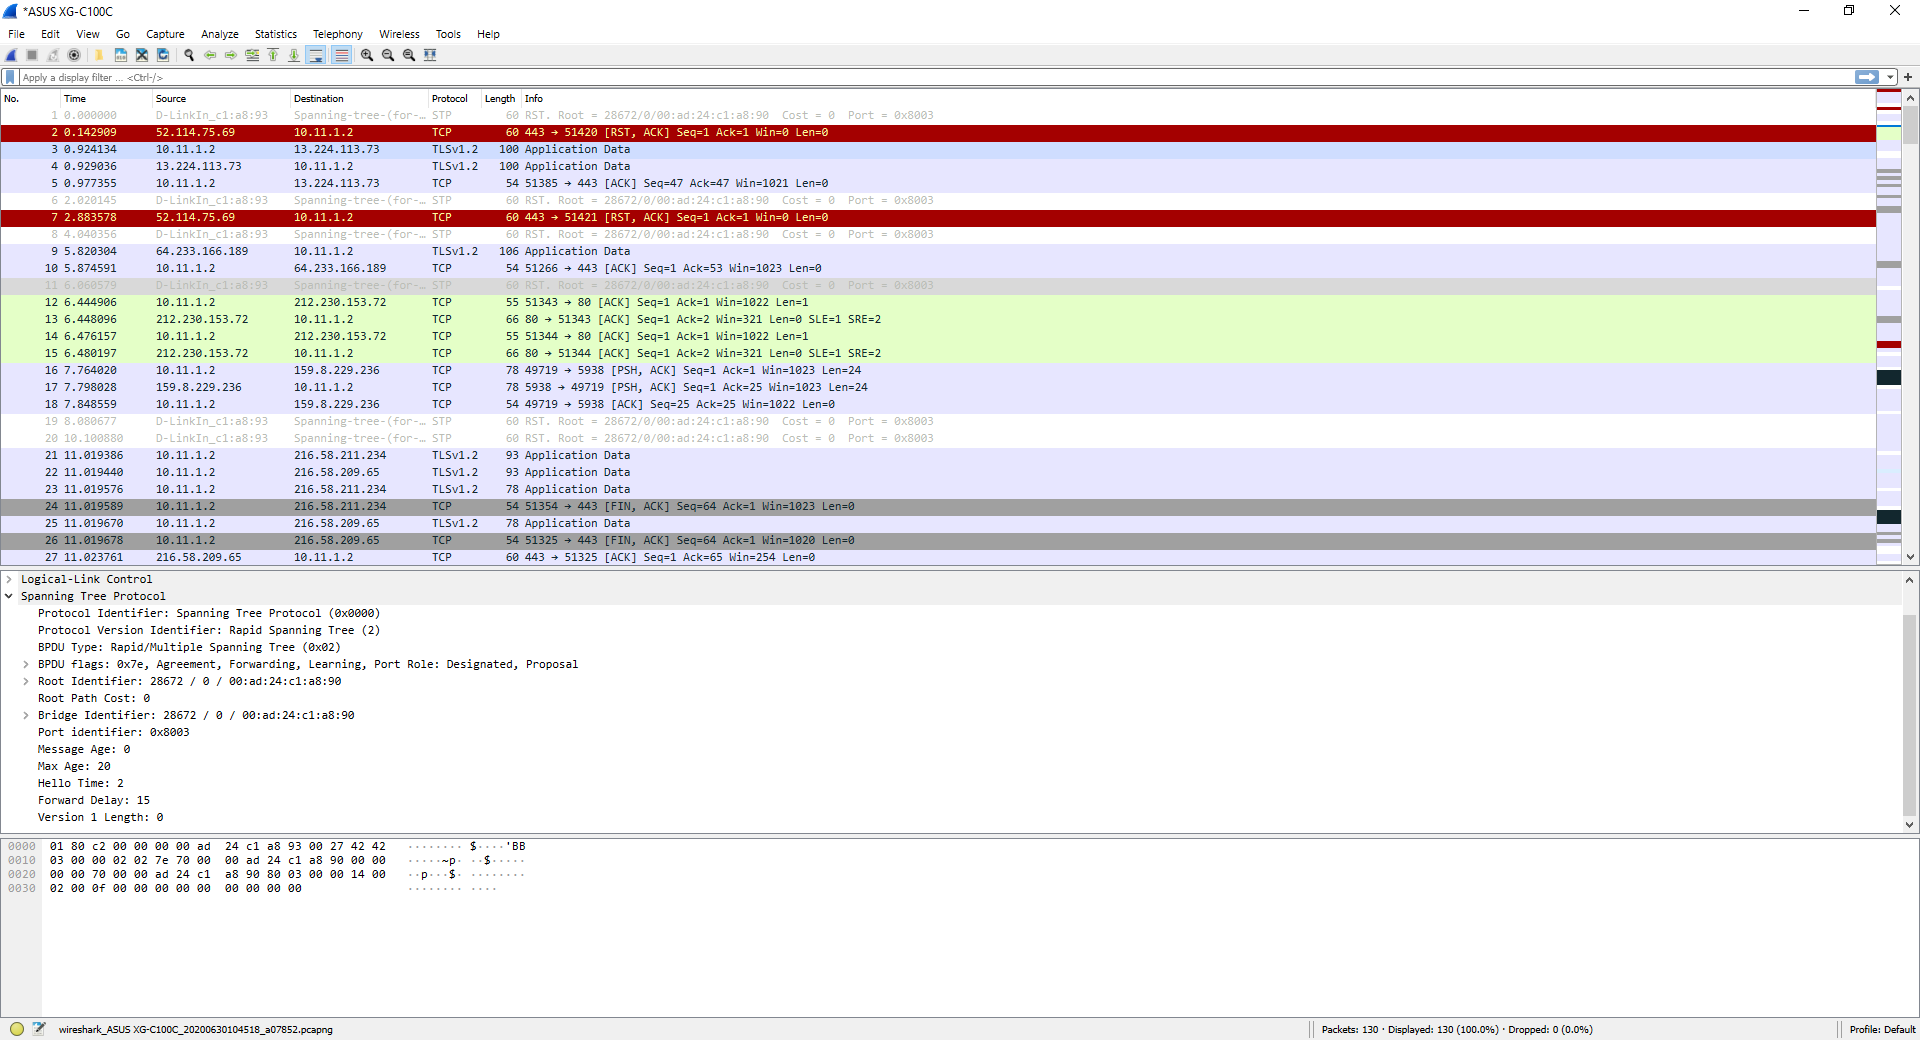
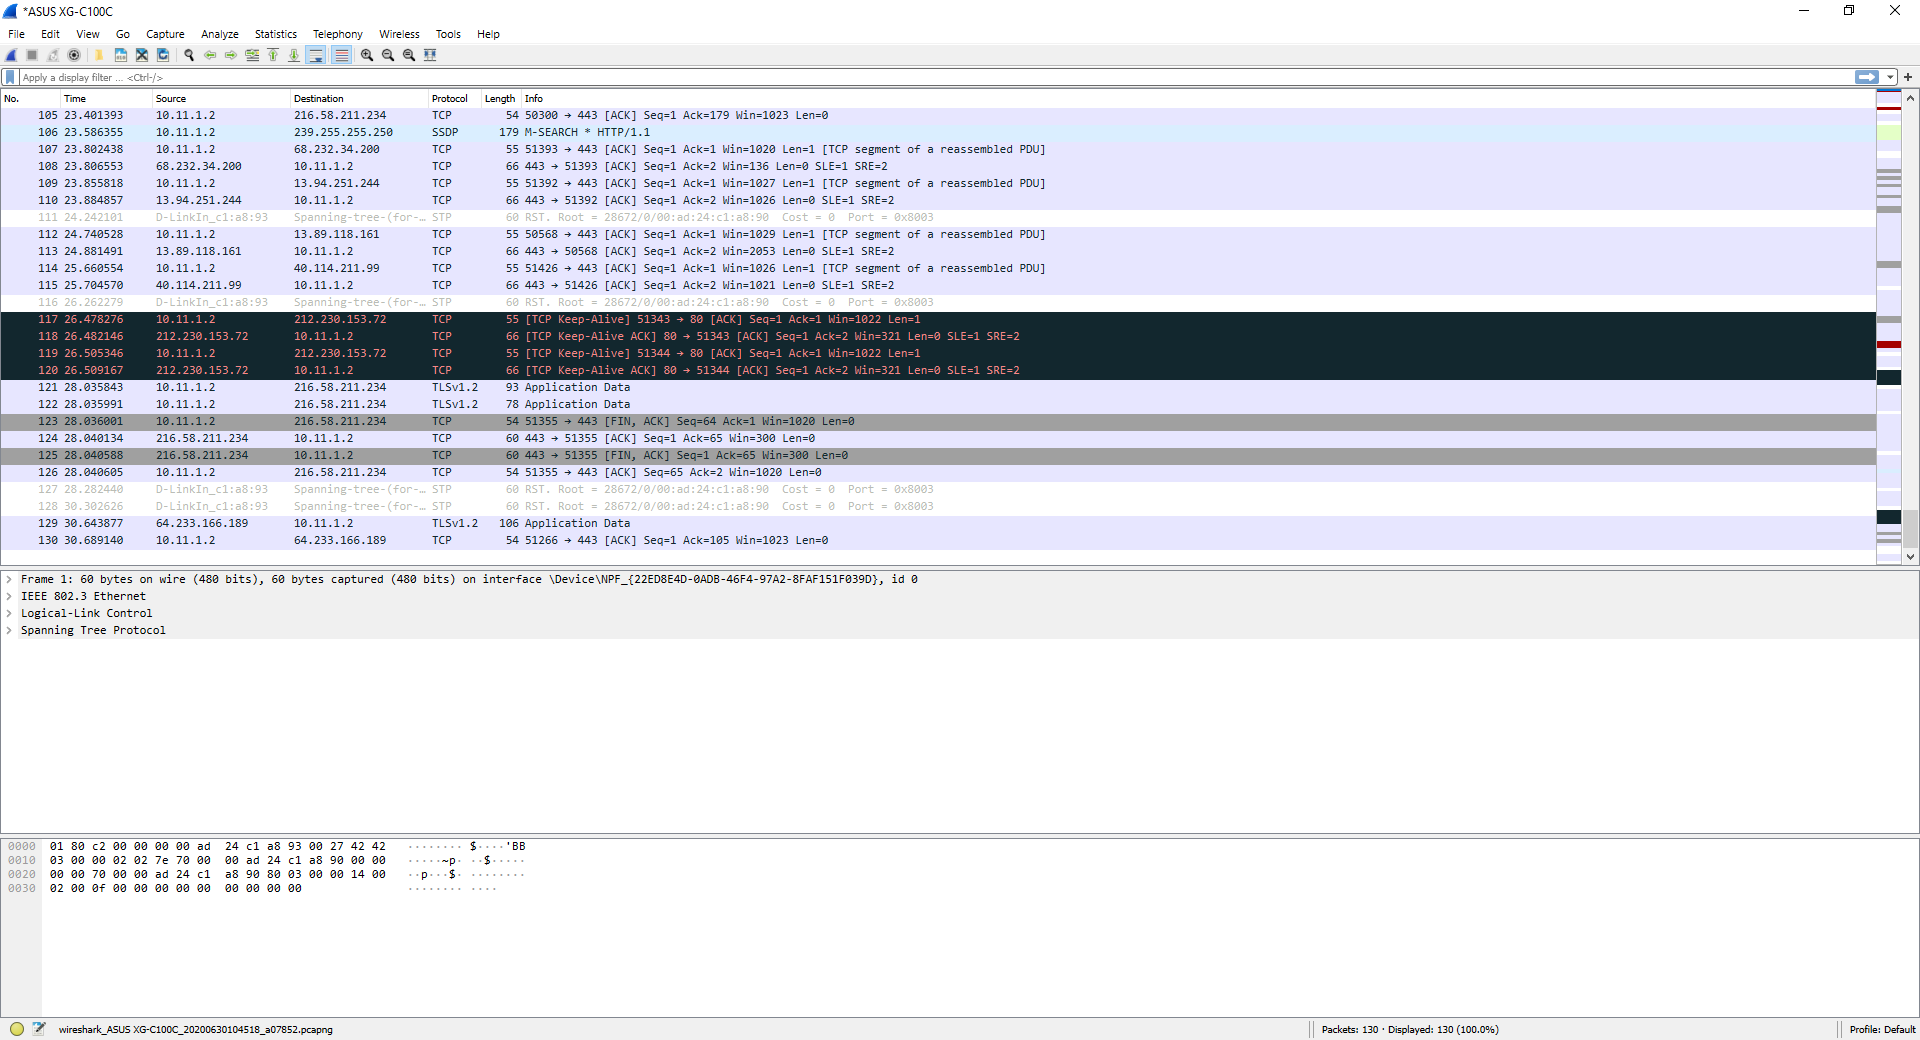
Of course, it will also tell us what the source and destination ports are if we use TCP or UDP, and we can even see in advance the sequence numbers, and if there has been an RST in the connection or if a segment had to be forwarded due to a problem.
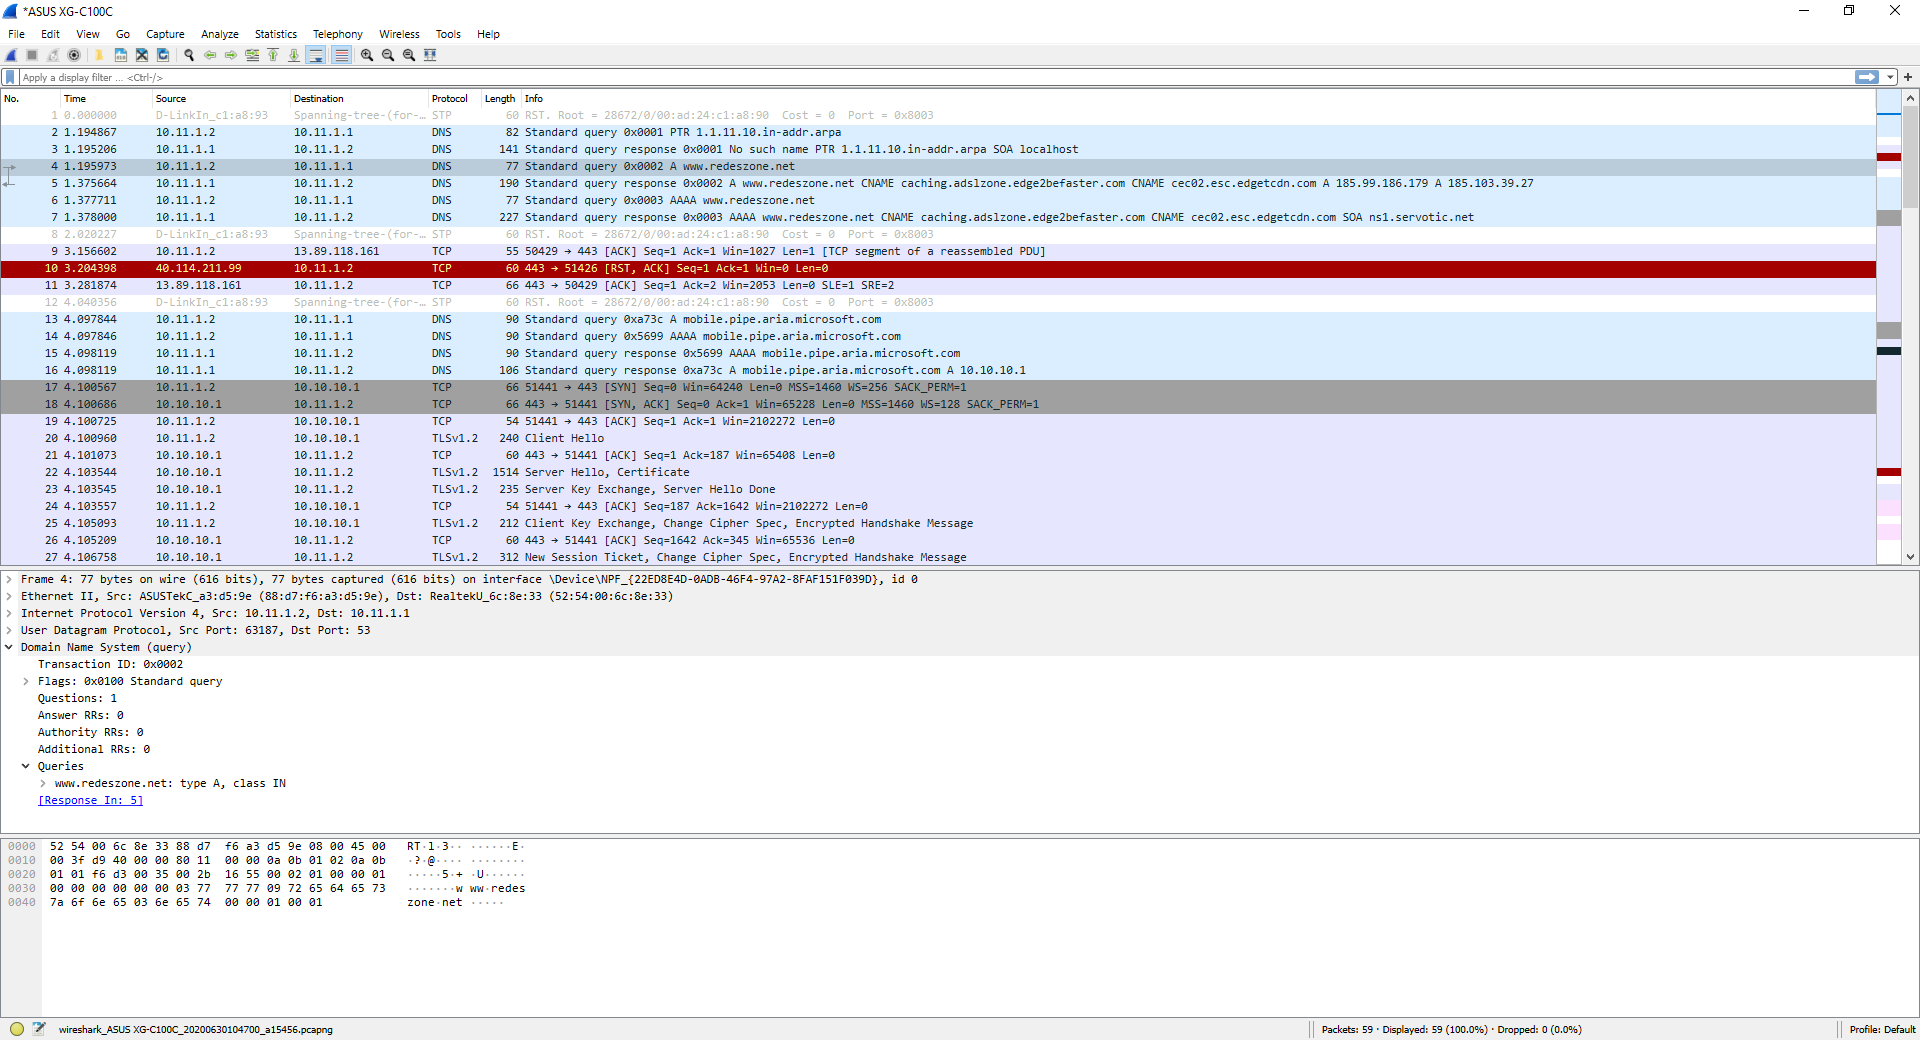
In the following screenshot, you can see the result of executing the command «nslookup www.redeszone.net» through console, make the DNS request to our DNS server, and it will automatically reply with the DNS resolution made from the previous domain. Of course, this traffic is “mixed” with other traffic that we have on our computer from different applications, for this reason it is so important to close all applications that use Internet connectivity before starting to capture traffic.
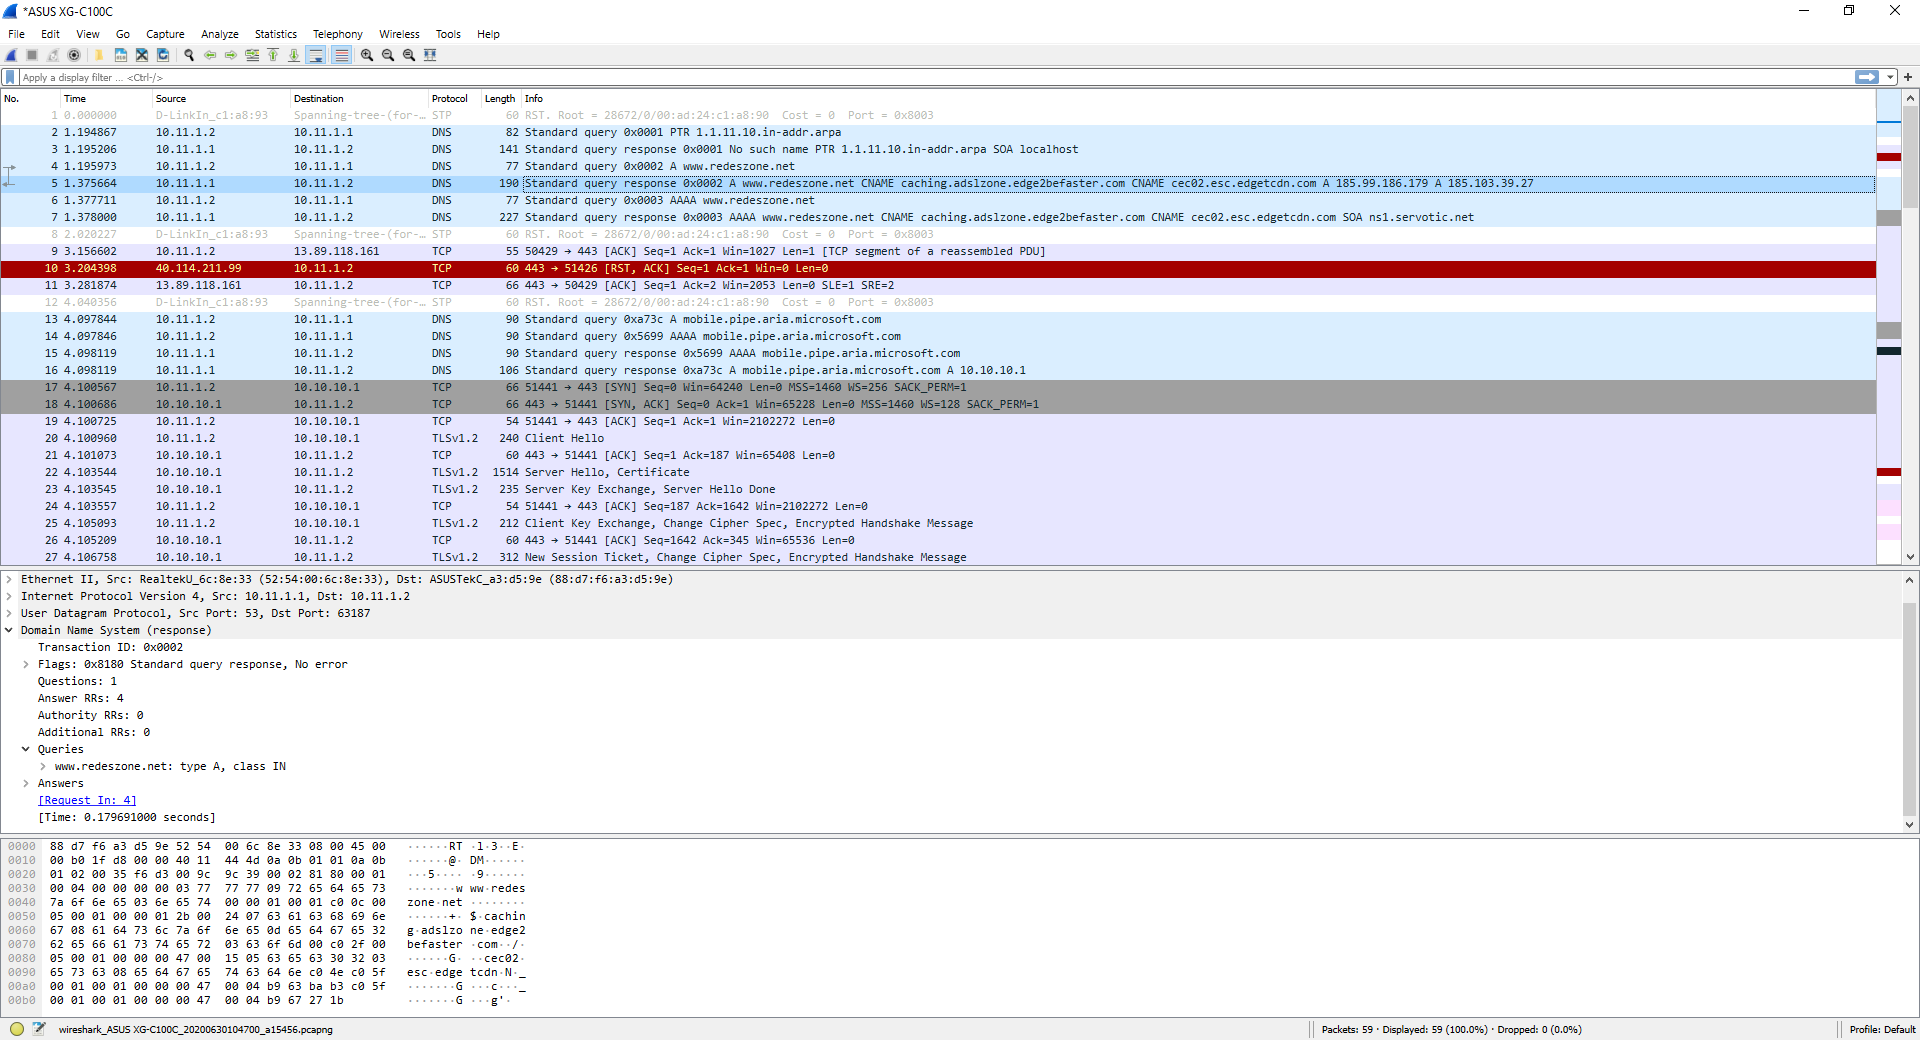
Here you can see the DNS server response to the previous DNS request:
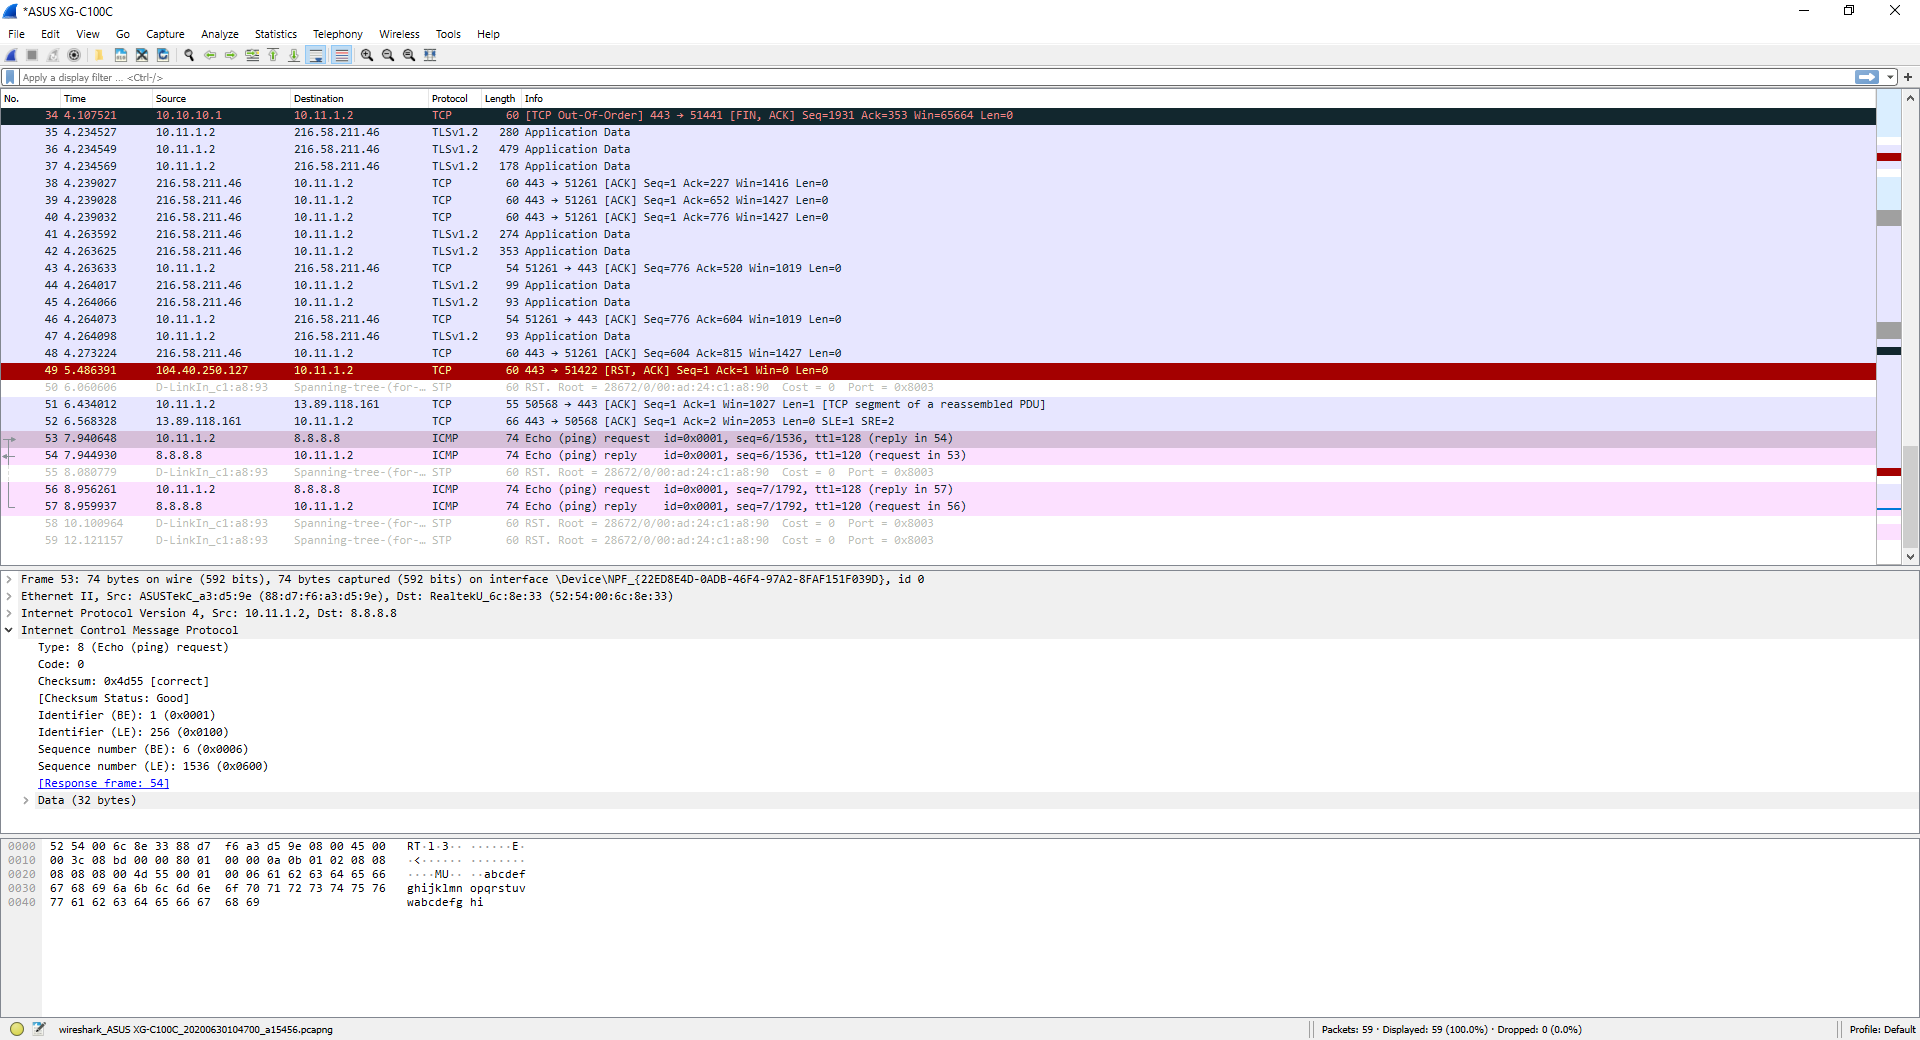
If we do the typical ping, using the ICMP protocol, it will also show us perfectly, it will show us both the «Echo request» and also the «Echo reply».
As you have seen, it is very easy to capture data with Wireshark to analyze all network traffic. If we want to save this capture, we simply have to click on the red “Stop” button to stop the data capture, and then click on “File / Save” to save it.
This capture can be saved on our computer or on an external medium for later analysis, or sent to an expert who is capable of detecting the problem, although you should bear in mind that it will have access to all the captured traffic, so you must send this capture someone you trust. If we have captured traffic with TLS or IPsec, you will need the corresponding decryption key, so you cannot “read” it without this information, the same goes for WPA / WPA2 traffic, without the key, you cannot read internal traffic .
We hope that this tutorial helps you to capture data traffic with this great program, and you will be able to detect problems on the network.
