
A friend linked me a video showcase of some of the tools that Tomorrow Corporation uses to make video games. If you haven't seen it yet, I recommend at least giving it a skim--it's a really cool set of tools, that includes live editing of code, the ability to watch a scene as it renders in piece-by-piece, and time travel debugging.
While the first two are available in spotty, limited ways depending on language, runtime, target, and a million other variables, the thing that stood out to me most was time travel debugging. I'd seen it discussed a lot in programming circles as sort of the holy grail of debugging, but had never looked into it myself. After seeing it in action though, my curiosity was piqued.
And of course, I wondered 'is this available for Rust?'
Wait, what's "time travel debugging"? 🔗
Also sometimes called "reverse debugging", it is, put really simply, the ability to step forward, or backward any number of times while debugging. As you step backward, the universe--the stack, all the local variables, all your watched variables--step back in time as well. I don't know how many times I've had my IDE set up to automatically break on some exception, or error case, but by the time I actually get there, the state of the program is such a mess that it's a real job to figure out where things started going wrong.
If you could just step backward from the point where things all went wrong, there are plenty of scenarios where finding the issue would be a lot easier.
Some Caveats 🔗
Some important notes before we start. Time travel debugging relies on certain hardware monitoring capabilities, which means that availability is pretty limited. So, I want to be really clear: my setup, and the following tutorial will only cover:
- Non-virtualized Windows 10 (no Parallels, sorry Mac folks)
- Using WinDbg, Microsoft's debugger for native code and kernel-mode code
- Rust code compiled with the
x86_64-pc-windows-msvctarget triple. (i686-pc-windows-msvcprobably works too, but I haven't tried it.)
All clear? Good! Let's move on.
Setting Up 🔗
As I alluded to above, we'll need some specific tools. First of all, you'll need a non-virtual Windows install.
Second, you'll need a copy of WinDbg (Preview) from the Windows Store. If, for whatever reason you can't use the store, there are ways to get this version of WinDbg in other ways, but I haven't used them myself, and can't speak to them. Either way, old WinDbg won't do--it doesn't know how to time travel.
Finally, you'll need the Rust tools installed, and be able to compile to the x86_64-pc-windows-msvc target. I'm assuming you have Rustup installed and managing your Rust toolchain. If not... you should.
You can check your installed targets with the following command:
rustup target list --installed
If you see x86_64-pc-windows-msvc, then you're good to go. If not, you should just be able to do
rustup target add x86_64-pc-windows-msvc
...and you'll be in business.
Producing something debuggable 🔗
Okay! We've got everything we need. Let's produce something to debug. Let's start simple.
> cargo new time-travelling-debugging
     Created binary (application) `time-travelling-debugging` package
The generated main.rs is pretty barebones. Not a lot of interesting state to demonstrate time traveling with.
Let's add some simple stuff to give us a few things to play with.
Here, why not something like...
use std::{error::Error, io};

fn main() -> Result<(), Box<dyn Error>> {
    let mut buffer = String::new();

    println!("Let's make a pony! Enter a name!");
    io::stdin().read_line(&mut buffer)?;
    let name = String::from(buffer.trim());
    buffer.clear();

    println!("\nEnter an age!");
    io::stdin().read_line(&mut buffer)?;
    let age: u32 = buffer.trim().parse()?;
    buffer.clear();

    println!("\nEnter a wingspan (in inches), or leave blank (or enter an invalid value) for a wingless pony.");
    io::stdin().read_line(&mut buffer)?;
    let wingspan: Option<u32> = buffer.trim().parse::<u32>().map_or(None, |a| Some(a));
    buffer.clear();

    println!(
        "\nEnter a horn length (in inches), or leave blank (or enter an invalud value) for a hornless pony."
    );
    io::stdin().read_line(&mut buffer)?;
    let horn_length: Option<u32> = buffer.trim().parse::<u32>().map_or(None, |h| Some(h));
    buffer.clear();

    let user_pony = Pony::new(&name, age, wingspan, horn_length);
    println!("Your new pony is: {:?}", user_pony);

    Ok(())
}

#[derive(Debug)]
pub struct Pony {
    pub name: String,
    pub age: u32,
    pub wingspan: Option<u32>,
    pub horn_length: Option<u32>,
}

impl Pony {
    fn new(name: &str, age: u32, wingspan: Option<u32>, horn_length: Option<u32>) -> Pony {
        Pony {
            name: String::from(name),
            age,
            wingspan,
            horn_length,
        }
    }
}
This gives us four intermediate variables (name, age, wingspan, and horn_length), as well as a single String buffer that gets reused over the program's lifetime, as well as an external function. Plenty of things to watch or rewind.
Let's compile it, and then we can start setting up WinDbg.
cargo build --target=x86_64-pc-windows-msvc
   Compiling time-travelling-debugging v0.1.0 (C:\Users\username\Desktop\Repositories\time-travelling-debugging)
    Finished dev [unoptimized + debuginfo] target(s) in 0.35s
Note that I explicitly passed --target=x86_64-pc-windows-msvc to cargo. If you installed Rust on Windows with default settings, this probably isn't necessary. Still, if you get an error at this point, that's a sign that something with your configuration needs attention before you can proceed.
WinDbg 🔗
Okay. Let's boot up WinDbg. You'll probably be greeted with something like this:
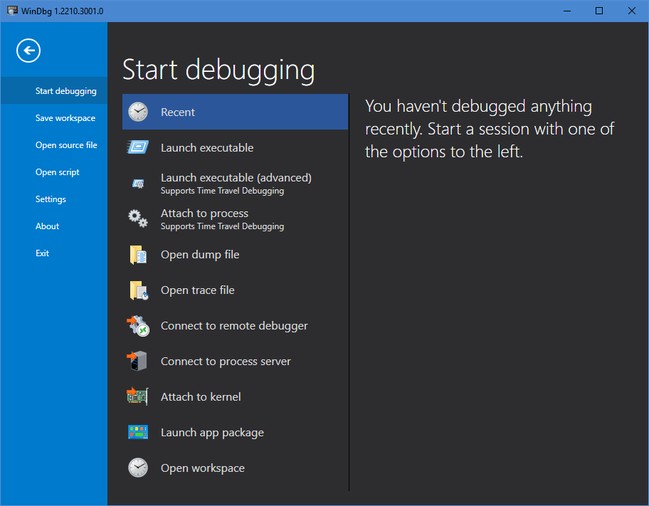
For this, we want "Launch executable (advanced)".
That'll present a small dialog that asks a few questions. They're mostly self-explanatory, but I'll lay them out:
Executable
The fully-qualified path to the .exe produced by cargo build up above. For me, that was C:\Users\username\Desktop\Repositories\time-travelling-debugging\target\x86_64-pc-windows-msvc\debug\time-travelling-debugging.exe
Arguments
These will be passed directly to the executable. Since our executable doesn't take any args, we can leave this blank.
Start directory
The working directory for our executable. Since it doesn't read or write to disk, this isn't that important. I set mine to the path that the executable was in, e.g. C:\Users\username\Desktop\Repositories\time-travelling-debugging\target\x86_64-pc-windows-msvc\debug\.
Target architecture
Autodetect is probably fine. Since I'm on a 64-bit machine and producing 64-bit executables, I could set this to 64-bit, but autodetect seems to get things correct.
Debug child processes
We don't spawn any, so feel free to leave this unchecked.
Record with Time Travel Debugging
That's the good stuff. That's what we're here for. Check this.
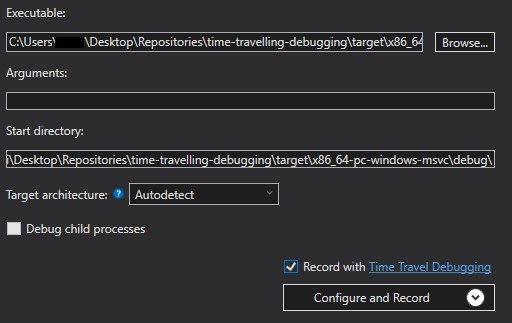
Once we click "Configure and Record", it will ask one last question:
Save location
This is where WinDbg will save the trace and index files that it records while our application is running. These trace and index files are the things that allow the actual time travel. They're also quite large, and are allowed to grow without bound!
Put them somewhere you're likely to clean out regularly. I put mine next to the generated executable, as I tend to consider those directories transient:
C:\Users\username\Desktop\Repositories\time-travelling-debugging\target\x86_64-pc-windows-msvc\debug
Once you click "Record", WinDbg will launch your executable, and begin recording its execution. Note that it will ask for Admin elevation if you didn't launch WinDbg elevated--Time Travel Debugging requires Admin rights.
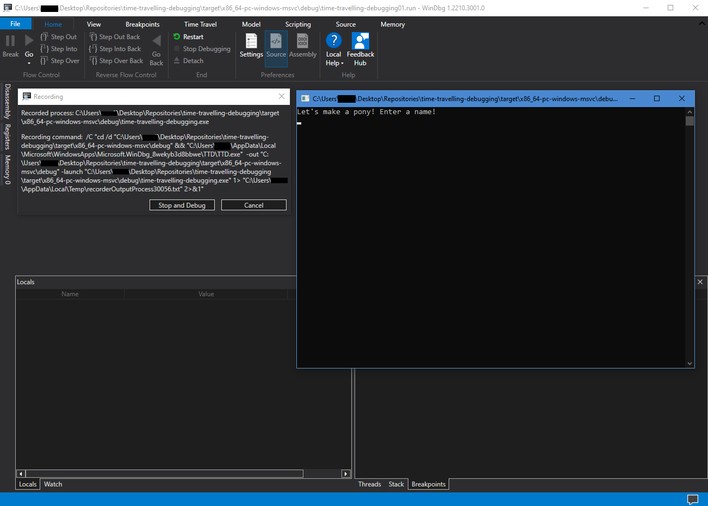
Enter in your various pieces of pony information as normal. Once your program terminates, WinDbg will do some cleanup. Once it has the trace ready, you can start debugging, both forwards and backwards.
Unfortuantely, the default view that WinDbg gives you isn't very friendly. Let's fix that!
First, click on View up at the top. Click on Command. This summons a pane that shows WinDbg's output, and allows you to interact with it using various commands, which are too numerous and complex to get into here.
The other thing you're likely to want, is your actual source code! To view that, click on Source up at the top, then click Open Source File. Then, navigate to our main.rs and open it up. Note: In the resulting file dialog, you'll need to change the filter from "C/C++ files" to "All files", or it will filter out your .rs files.
Now, if we go back to the Home tab, you'll see that we've got buttons for a variety of things: Break, Go, Step Out, Step Into, Step Over.
But! More fun, right next to those, we also have Step Out Back, Step Into Back, and Step Over Back. Neat!
Let's set a breakpoint on Line 4, the first line of the main() function, and hit Go. The debugger should proceed, then halt at that breakpoint.
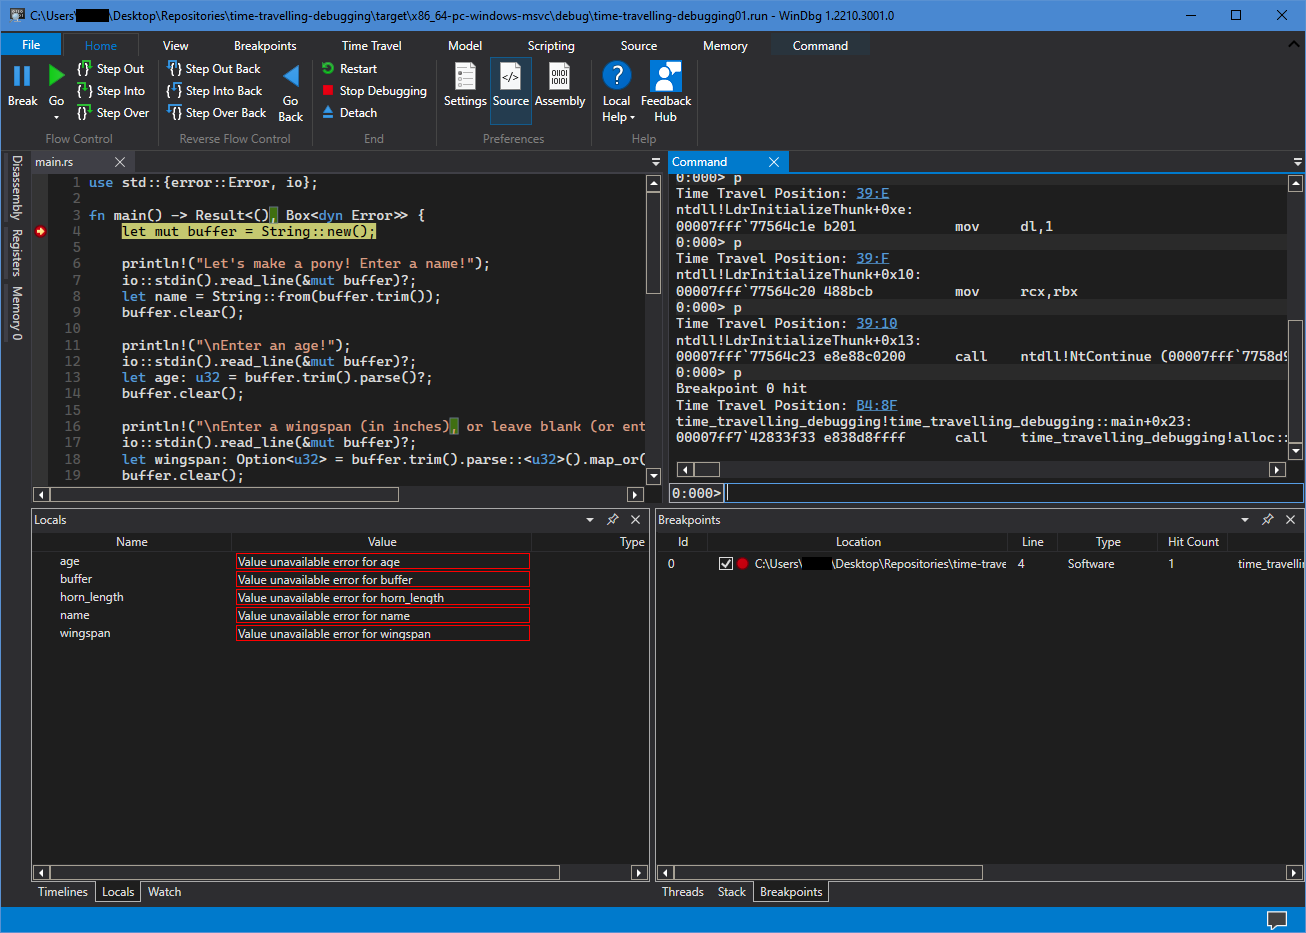
You're now free to step forward and backward to your heart's content. At the bottom, Locals and the current stack will display as usual. The visualization for Rust data structures in Locals and Watch isn't amazing, but it's also about the same as we get in LLDB.
Caveats and Tweaks 🔗
So obviously, this comes with a great big pile of "but"s, some of them big and stinky. Let's take a look at them.
- This isn't live debugging. You're essentially debugging a recording of the program's run.
- As such, you also can't tweak variable values while time travel debugging--no changing history.
- Breakpoints not working, or command window not showing correct function names? Try going to
File->Settings->Debugging settings, and adding the folder containing your program's generated.pdbfile. By default, it sits next to the executable. For me, it wasC:\Users\username\Desktop\Repositories\time-travelling-debugging\target\x86_64-pc-windows-msvc\debug. - This does work across multiple source files as well, though you may have to open those source files manually.
- By default, numeric values are displayed in hexadecimal. To change to another number base, in the
Commandwindow, enter the commandn base. So, if you wanted to display things in decimal,n 10. Back to hex?n 16. - How does this work with threads? Well... it's rough. WinDbg struggles to set breakpoints, and tracing execution gets tricky. It also seems to be impossible to name threads from Rust in a way that WinDbg understands.
- What about
async? No idea! Seriously, try it out and tell me, I'm curious. - Those trace and index files get big, fast. Clean 'em out once in a while, unless you want to hold onto specific program runs.
Closing thoughts, alternatives 🔗
So there you have it! Time traveling debugging in Rust. On Windows. With a specific proprietary tool. When targeting a specific triple.
What about other platforms? What about IDE integration?
🤷♀️ ¯\_(ツ)_/¯ 🤷♂️
As far as I know, LLDB doesn't support time travel debugging at all. Supposedly there is a way to make VSCode's LLDB plugin work with rr, which a dedicated time traveling debugger. rr only works on an actual Linux machine though--even WSL2 won't cut it. So, I wasn't able to try it out.
Apparently, GDB has a time traveling mode. I have zero experience using GDB with Rust code though, so if anyone has insight here, I'd love to hear it.
In any case! This can be a useful tool to keep in your back pocket if you're trying to dig out a tricky logic error, but the point of failure happens well after things have actually gone wrong. Hopefully this little primer helps some folks out when they just really need to get a little time travel done.
Thanks for reading!
As ever, you can leave a comment below, find me on Twitter at @pingzingy, or Mastodon as @PingZing@pony.social.
 The text of this blog post is licensed under a Creative Commons Attribution 4.0 International License.